Loading species…
Where it's been seen
Hotspots with reports in the last 30 days.
Loading recent sightings…
Loading ID help…
Loading this year…
Loading history…
 Travis County Birding
Search species and hotspots
Loading species…
Hotspots with reports in the last 30 days.
Loading recent sightings…
Loading ID help…
Loading this year…
Loading history…
Field marks that matter, and the birds it's most often mixed up with.
Royal TernVery rare
Check the bill and the underwing.[1, 4]
Lookalike photos from Wikimedia Commons: Royal Tern by Nicholas Atamas (CC BY-SA 2.5)
Recordings: Caspian Tern (flight call) by Paul Marvin (CC BY-NC-SA 4.0, xeno-canto); Royal Tern (song) by William Whitehead (CC BY-NC-ND 4.0, xeno-canto)
Shorebirds and gullsGulls, Terns, and Skimmers
Hydroprogne caspia
Very rareVery rare in Travis County but fairly common in Texas


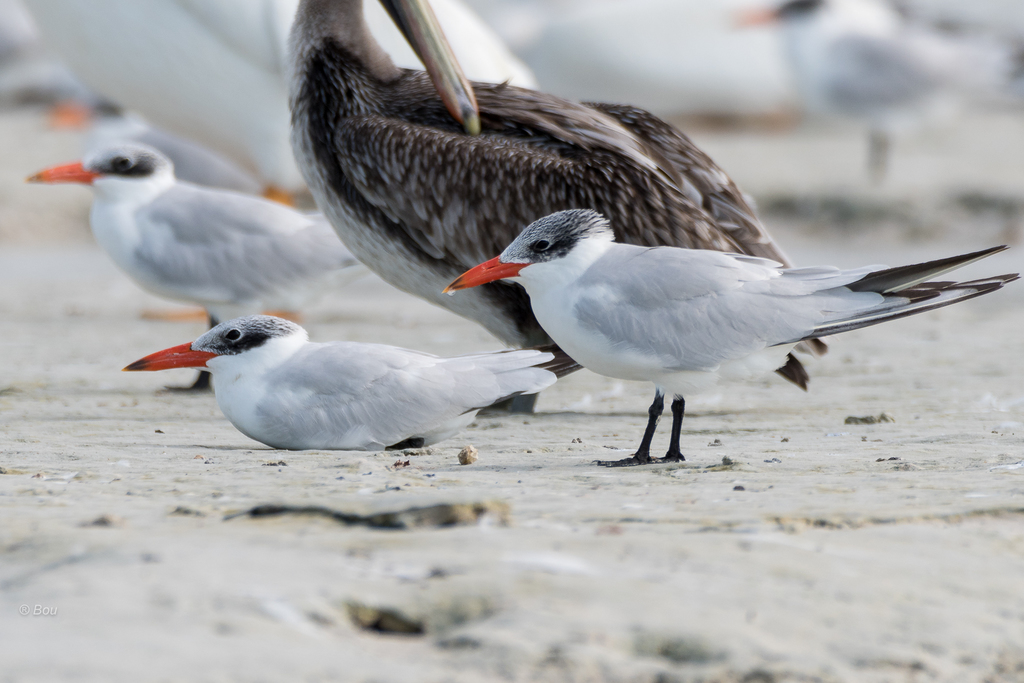
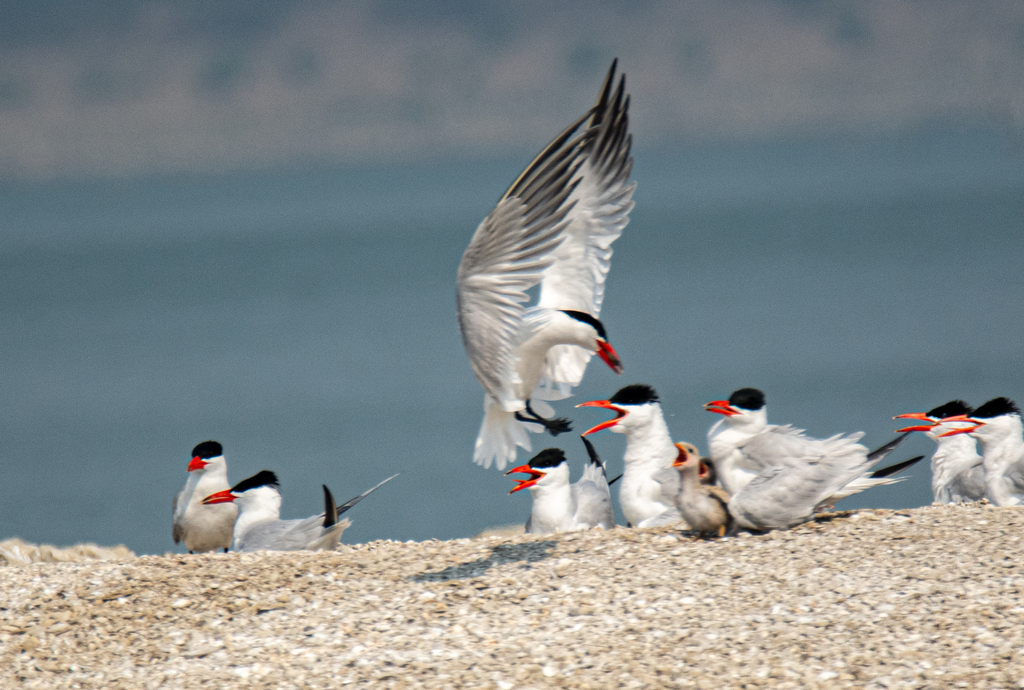

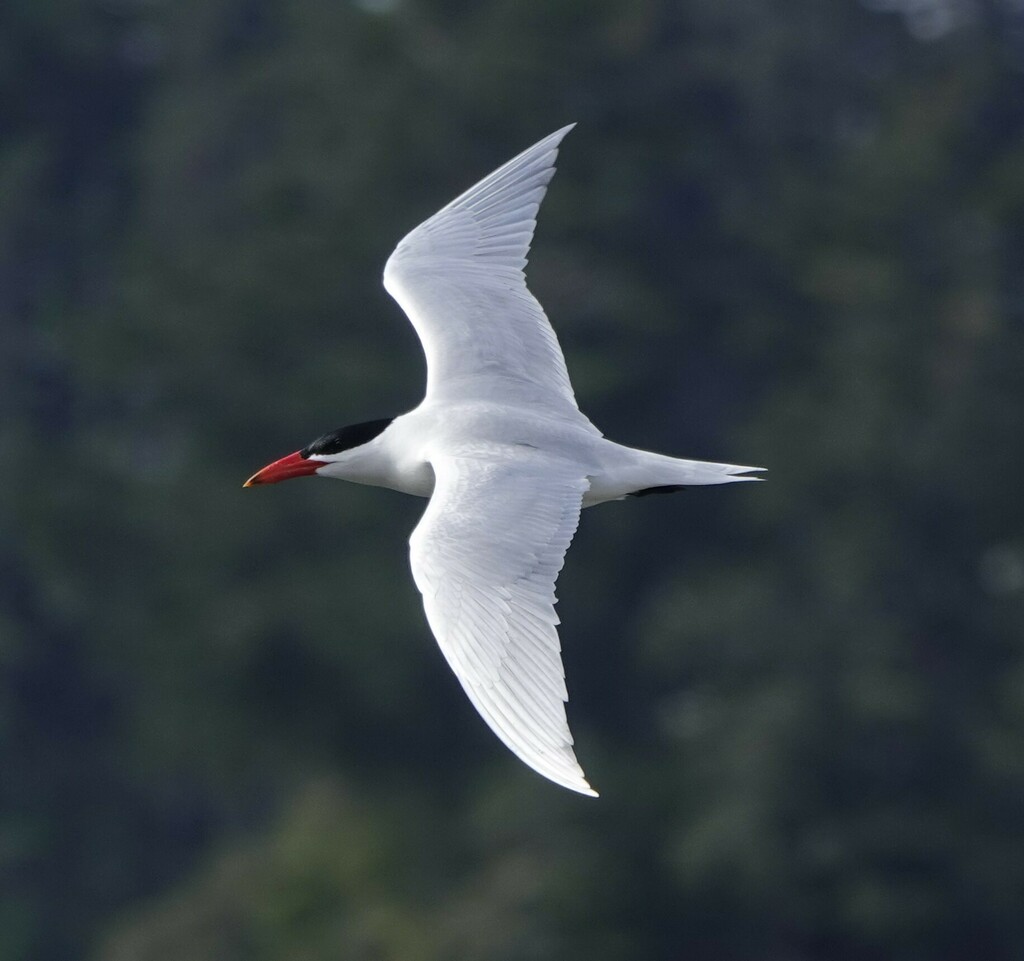


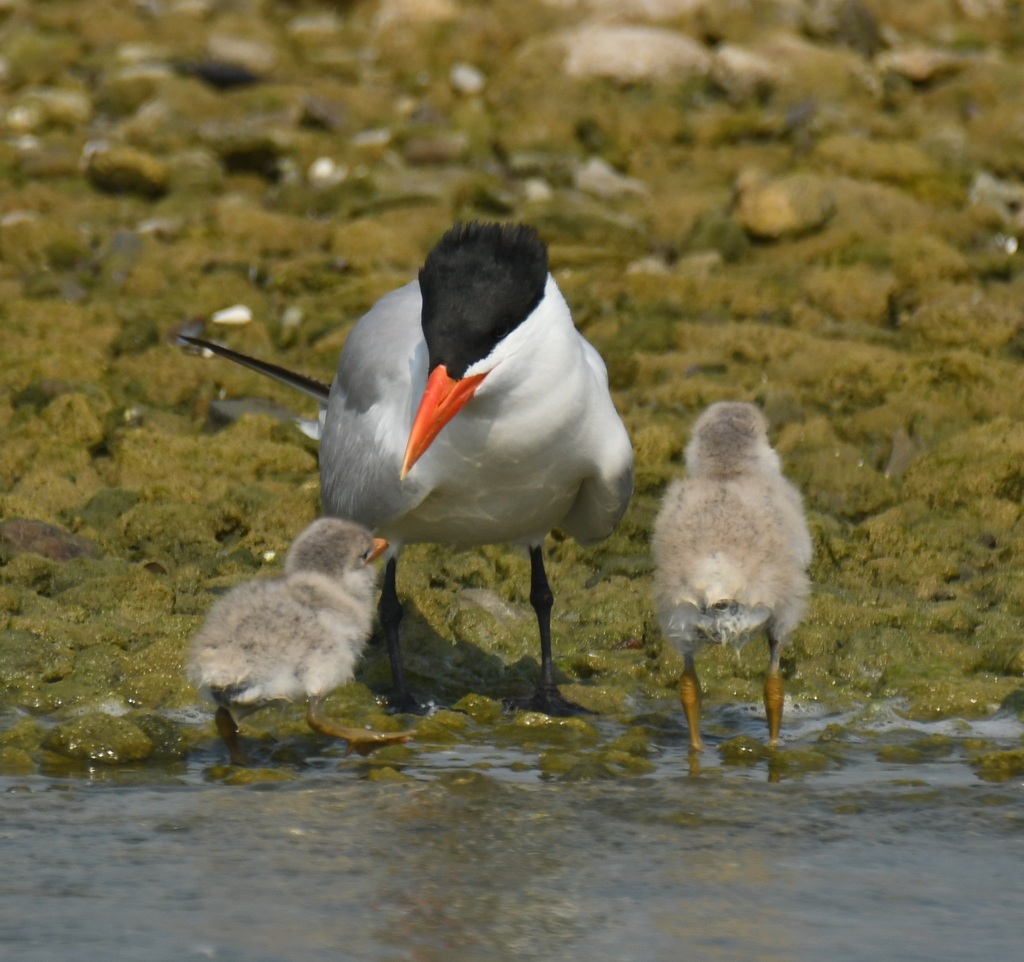
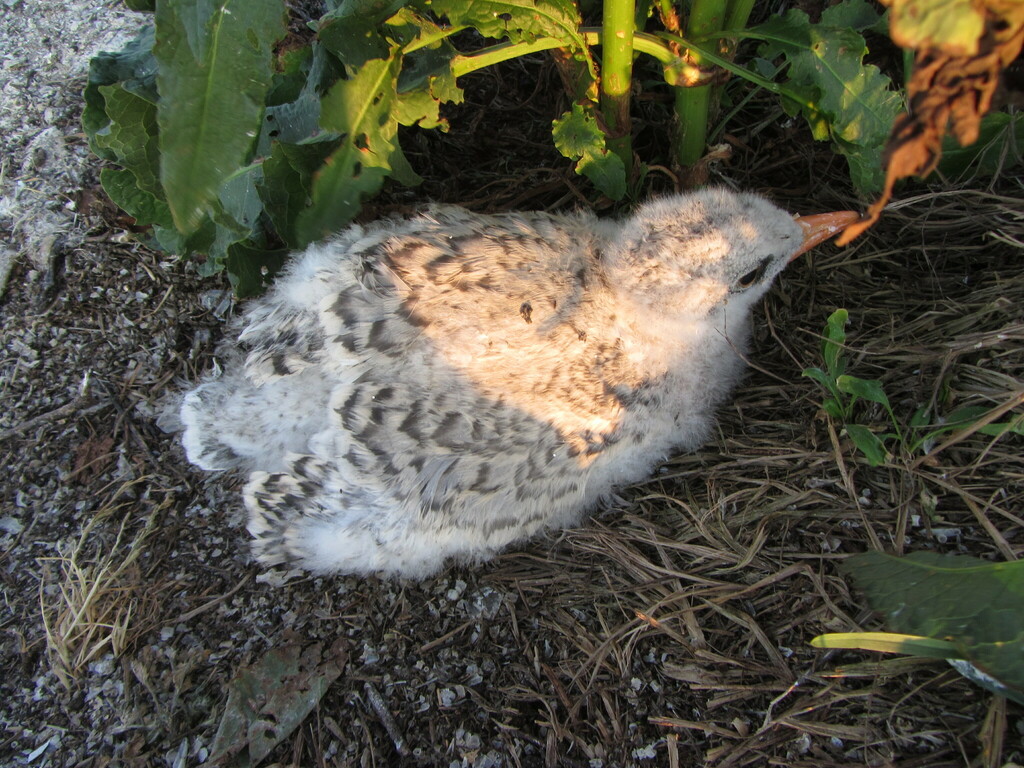
The Caspian tern is the world's largest species of tern, with a subcosmopolitan but scattered distribution. Despite its extensive range, it is monotypic of its genus, and has no accepted subspecies. The genus name is from Ancient Greek hudro-, "water-", and Latin progne, "swallow". The specific caspia is from Latin and, like the English name, refers to the Caspian Sea.
Read more on WikipediaFlight call · United States
Paul Marvin · xeno-canto XC452796 · CC BY-NC-SA 4.0
Call · United States
Andrew Spencer · xeno-canto XC203782 · CC BY-NC-SA 4.0
Call · United States
Andrew Spencer · xeno-canto XC203781 · CC BY-NC-SA 4.0
Call · United States
Andrew Spencer · xeno-canto XC203779 · CC BY-NC-SA 4.0
Not reported in Travis County in the last 30 days
Rare or irregular
| Week | Checklists reporting it |
|---|---|
| Jan 1–7 | 0% |
| Jan 8–14 | 0% |
| Jan 15–21 | 0% |
| Jan 22–end | 0% |
| Feb 1–7 | 0% |
| Feb 8–14 | 0% |
| Feb 15–21 | 0% |
| Feb 22–end | 0% |
| Mar 1–7 | 0% |
| Mar 8–14 | 0% |
| Mar 15–21 | 0% |
| Mar 22–end | 0% |
| Apr 1–7 | <0.1% |
| Apr 8–14 | <0.1% |
| Apr 15–21 | <0.1% |
| Apr 22–end | <0.1% |
| May 1–7 | 0.1% |
| May 8–14 | <0.1% |
| May 15–21 | 0% |
| May 22–end | 0.1% |
| Jun 1–7 | 0% |
| Jun 8–14 | <0.1% |
| Jun 15–21 | <0.1% |
| Jun 22–end | 0% |
| Jul 1–7 | 0% |
| Jul 8–14 | 0% |
| Jul 15–21 | 0% |
| Jul 22–end | 0% |
| Aug 1–7 | <0.1% |
| Aug 8–14 | 0% |
| Aug 15–21 | 0% |
| Aug 22–end | 0.2% |
| Sep 1–7 | 0% |
| Sep 8–14 | 0% |
| Sep 15–21 | 0% |
| Sep 22–end | 0% |
| Oct 1–7 | 0% |
| Oct 8–14 | 0% |
| Oct 15–21 | 0% |
| Oct 22–end (now) | 0% |
| Nov 1–7 | 0% |
| Nov 8–14 | 0% |
| Nov 15–21 | 0% |
| Nov 22–end | 0% |
| Dec 1–7 | 0% |
| Dec 8–14 | 0% |
| Dec 15–21 | 0% |
| Dec 22–end | 0% |
Share of complete checklists at each hotspot that reported it (2016–2026). Hotspots with fewer than 15 checklists are left out, and the order discounts small samples, so a hotspot with few checklists can sit below one with a lower share.
From the eBird Basic Dataset (Sep-2026), complete checklists only.
From every checklist reported in the county this year: who found it first, who finds it most, and when.
